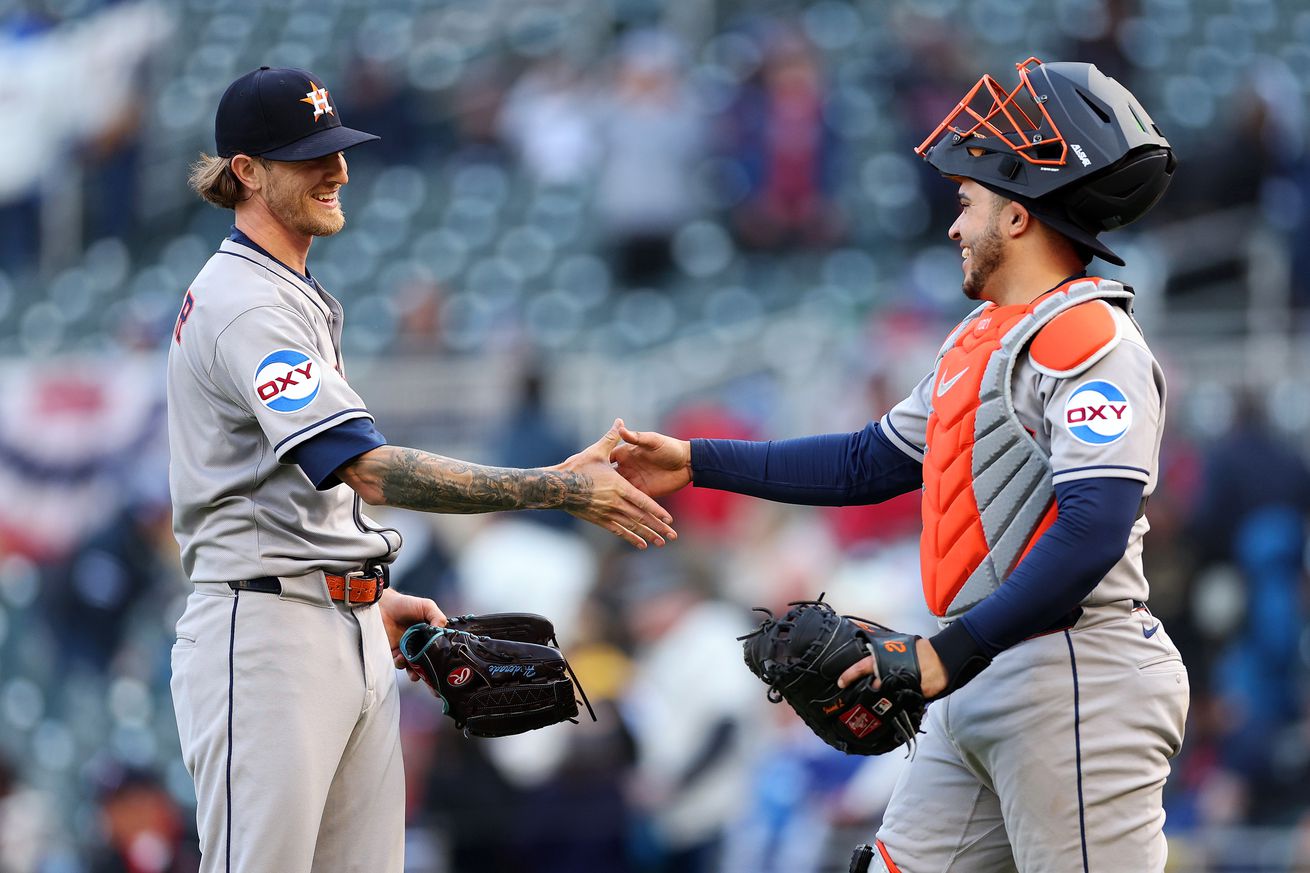
How is the relief corps performing in the early going?
Let’s check in on the Astros’ bullpen during these first 11 games of the season. The Astros’ bullpen (like most teams) is a work in progress at this early stage of the season. By that, I mean the team is still figuring out reliever roles to some extent, and new relievers (either returning from the injured list or being cycled between AAA and the ML roster) will affect the future composition of the bullpen.
All of the small sample caveats apply to our review. And this is particularly applicable to ERA or RA/9 which can have a distorted look because relievers have only pitched a few innings. That said, overall the stats for the Astros’ bullpen look pretty good at this early stage.
The Astros’ team bullpen ranking for several noteworthy stats:
K/9 12.66 1st
BB/9 3.59 12th
fWAR 12 2d
FIP 2.13 1st
SIERA 2.45 2d
Stuff PitchBot ERA 3.27 1st
Stuff+ 111 5th
Again, it’s obviously a small sample, but the team bullpen rankings are outstanding. The Astros are either 1st or 2d in several important categories. The Astros want high strike out pitchers, and they lead the majors in that category (K/9). This leads to a No. 2 ranking in FIP and SIERA. The Astros are also No. 1 in Fangraphs WAR.
The stuff-based pitching models also rank the Astros bullpen near the the top of the majors. The Astros are 1st in PitchBot ERA and 5th in Stuff+.
But there is a potential caution flag. The BB/9 ranking is a more pedestrian 12th at 3.59. The bullpen has good stuff and K ability, but the walk rate is too high. If we see a bullpen implosion at any time, walks likely will be a culprit.
In terms of individual reliever rankings, Josh Hader, Steve Okert, and Bryan King are 2d, 5th, and 7th in fWAR. Bryan King is ranked 8th in x-ERA. Steve Okert is 5th in K/9 (17.32).
Tayler Scott is a reliever to put on our “watch” list. He has struggled somewhat as of late (x-ERA over 7). But he has pitched only a little over 3 innings, which is a ridiculous sample for reaching any conclusions.
But the Astros planned for Scott to be an important link in the rotation. I suspect that the Astros believed that Scott’s sparkling ERA in 2024 made him the likely candidate to replace Ryan Pressly as the third best reliever. However, as I wrote several times over the past year, Taylor Scott’s 2024 results had “regression” written all over it. (See my recent article on 2025 pitcher regression candidates here. Scott looked likely to regress almost 2 runs higher ERA in 2025.) In brief, this means that his peripheral stats didn’t support the sparkling sub-3 ERA in 2024. And, in my mind, it’s a risk to use him as the top reliever behind Abreu and Hader.
That said, despite the recent poor small sample results, I suspect that he has looked worse than what he is likely to stabilize at over the course of the season. His current Stuff+ is pretty much the same as 2024. His x-ERA , FIP, and x-FIP are not good, but these forward looking “expected” stats are lower than his current ERA. His current K rate is fine. And his PitchBot ERA is 4.04, which is pretty much in the range of his rest-of-season projections (4.10 – 4.15). Perhaps another reliever will replace him in the role of third best reliever, but there is reason to believe that he will stabilize into an acceptable 4-ish ERA which can fit into the bullpen.
Looking at Scott’s BB/9 rate for 2025, it’s clear that his problem so far is related to control. His current BB/9 of 8.10 is twice as high as projected and higher than any season of his career. If Scott can improve his walk rate, his performance should stabilize at an acceptable level.
A Note on Win / Loss Record
The Astros are at the 11 game point of the schedule. The Astros record is 5-6. How does that stack up with the previous seasons? Here is the record at 11 games for the last five years.
2025 5-6
2024 4-7
2023 5-6
2022 6-5
2021 6-5
I’m not saying this tells us a lot. In fact, it probably doesn’t—which is kinda my point. The current record is the same as 2023 and is within 1 game of each of the four prior seasons. The record at 11 games played isn’t predictive of anything. The W/L trajectory for each of these seasons was driven by future games in April and May and the trajectory often changed month to month until the end of the season.